
| Particulars | ICICI Bank | HDFC Bank | Kotak Mahindra | Axis Bank |
|---|---|---|---|---|
| NII | ₹14,787 | ₹21,021 | ₹6,620 | ₹10,360 |
| NII Growth YoY | 26% | 18.9% | 24% | 31% |
| Net Profit | ₹7,558 | ₹10,606 | ₹3,608 | ₹5,330 |
| Profit Growth YoY | 37% | 20% | 21% | 70% |
| Advances Growth YoY | 24% | 23.4% | 25% | 18% |
| Net Interest Margin | 4.31% | 4.1% | 5.17% | 3.96% |
| Gross NPA | 3.19% | 1.23% | 2.08% | 2.50% |
| Net NPA | 0.61% | 0.33% | 0.55% | 0.51% |
| CAR | 18.27% | 18.0% | 22.6% | 17.72% |
| CASA | 45% | 45.4% | 56.2% | 46% |
Top Private Banks Q2FY23 Earnings Comparison

4 ways to get the best out of your Systematic Investment Plan (SIP)

A systematic Investment Plan (SIP) is an investment route offered by Mutual Funds wherein one can invest a fixed amount in a Mutual Fund scheme at regular intervals– say once a month or once a quarter, instead of making a lump-sum investment.
SIP has been gaining popularity among Indian MF investors, as it helps in investing in a disciplined manner without worrying about market volatility and timing the market. SIP is easily the best way to enter the world of investments, here are some tips to get the best out of your SIP investments
1. Choose Direct Plans
Direct plans have lesser costs and give higher returns than regular plans. If the Total Expense Ratio (TER) of a regular plan is 0.75% more than that of the direct plan, then the direct plan will give a 1% higher CAGR return than the regular plan. Over a long investment horizon, if you compare the returns of mutual fund direct vs regular plans, the direct plans can add up to a substantial amount of difference in returns on your investment.
2. LTCG Tax Harvesting
Tax harvesting is utilising the tax-free window of Rs 1 lakh to reduce the overall LTCG tax. If you have invested and gained Rs 1 lakh, you can sell your investment, realise that gain, and invest it back without being liable to pay taxes. On the surface, LTCG tax harvesting savings could appear insignificant. However, when your portfolio expands and the period of wealth generation lengthens, these modest sums can easily add up to substantial sums.
3. Invest during drawdowns
Maintain a separate fund that is only used for stock market corrections. The stock market is subject to corrections; on average, the Nifty 50 has dropped more than 10% from its high each year at some point. By adding more to the mutual fund investments in response to corrections like these, you can improve your CAGR returns.
4. Choose Top-Up SIP
In a Top-up SIP, the investor increases his SIP amount every year, As an individual increases his income over time, it makes sense to increase investment contributions at the same rate. Top-up SIP helps in accumulating a higher amount of money, achieving your financial goals faster & keeping up with inflation.
Open Demat Account with India’s Number One Stock Broker; Zerodha
Mahurat Trading Day: Nifty 50 Performance History, Trading Hours & more

Diwali is the festival of lights and auspicious times. People buy gold, vehicles, and other such valuable items in the days of Diwali as it’s believed to bring prosperity (barkat) and happiness in their lives. While there are abundant ways of celebrating Diwali, Indian stock exchanges like NSE and BSE celebrate by conducting a special one-hour ‘Muhurat Trading Session’ that marks the beginning of the Hindu Calendar year.
Digging deep into the history of Muhurat Trading, traditionally, stockbrokers started their new year on Diwali. Hence, they would open new settlement accounts for their clients in this auspicious period – The Muhurat. With diverse cultures, the beliefs associated with Muhurat Trading also varied. Today, Muhurat Trading has become more of a symbolic gesture than a cultural one as Hindu investors perform Lakshmi Pujan and purchase shares of strong companies that guarantee good future returns.
Stock exchanges BSE and NSE will conduct the once-in-a-year Muhurat trading on 24th October 2022, Monday from 6.15 pm to 7.15 pm as the trading community welcomes Day 1 of the Hindu accounting calendar Samvat.
Nifty 50 Levels on Deepawali over the years
Nifty 50 performance on the Mahurat Trading Day

Important Ratios To Evaluate a Banking Company

The financial statements of banks are typically much more complicated than those of companies engaged in virtually any other type of business. While investors considering bank stocks look at such traditional equity evaluation measures as price-to-book (P/B) ratio or price-to-earnings (P/E) ratio, they also examine industry-specific metrics to more accurately evaluate the investment potential of individual banks.
1. Non-Performing Assets (NPAs)
What are NON PERFORMING ASSETS? NPAs are of Two Types
1. GNPA:- Loans where interest is not received for a period of 3 months, a loan turns into NPA. GNPA tells us about the financial condition of the bank. High GNPA tells us that the asset quality of the bank is in bad shape.
Lower the better.
2. NET NPA:- Banks provide for some loans going bad. The net NPA is that portion of bad loans which has not been provided for in the books.
Net NPA gives us a better view of the financial health of the Bank as by this ratio we get to know about the ability of the bank to provide for Non-Performing Assets.
Lower the better.
2. Capital Adequacy Ratio(CAR)
It is the ratio of a bank’s capital in relation to its risk-weighted assets and current liabilities. This is a measure of a bank’s ability to meet its obligations. A high CAR means the bank can absorb losses without diluting capital.
Higher the Better.
3. Current Account, Savings Account Ratio (CASA Ratio)
It is the proportion of current account and savings account deposits in the total deposits of the bank. Lower CASA Ratio means the bank relies on costlier wholesale funding which may hurt the margin of the bank. As we know that no interest is given by banks on Current Account deposits & an interest rate of as low as 3.5% is given on Saving Account Deposits, these are relatively very cheap source of financing for banks as compared to other sources.
Higher the Better.
4. Provisioning Coverage Ratio
Provisioning means to set aside or provide some funds to cover up losses if things go wrong and some of their loans turn into bad assets. A high PCR ratio (ideally above 70%) means most asset quality issues have been taken care of and the bank is not vulnerable.
Higher the Better.
5. Net-Interest Margin
The difference between interest earned by a bank on loans and the interest it pays on deposits is called Net-Interest Margin. Net-Interest Margin will be high for banks with higher low-cost deposits or high lending rates. In particular, for a bank, if the bank has a significant amount of non-performing assets (such as loans where full repayment is in doubt). NIM will generally decrease because interest earned on non-performing assets is treated, for accounting purposes, as repayment of principal and not payment of interest due to the uncertainty that the loan will be fully repaid.
Higher the Better.
6. Credit-Deposit Ratio
This shows how much a bank lends out of its deposits. A high credit-deposit ratio suggests an overstretched balance sheet, and may also hint at capital adequacy issues. Credit-Deposit Ratio helps in assessing a bank’s liquidity and indicates its health.
If the ratio is too low, banks may not be earning as much as they could be.
If the ratio is too high, banks might not have enough liquidity to cover any unforeseen fund requirements which may affect capital adequacy.
7. Return On Assets(ROA)
It shows how profitable a bank’s assets are in generating revenue. A lower RoA means that the bank is not able to utilize assets efficiently. Negative ROA implies the bank’s assets are yielding a negative return. The term return in the ROA ratio or Net Profit to Total Assets customarily refers to net profit or net income, the number of earnings from sales after all costs, expenses, and taxes. The more assets a company has amassed, the more sales and potentially more profits the company may generate. As economies of scale help lower costs and improve margins, the return may grow at a faster rate than assets, ultimately increasing return on assets.
Higher the better.
Open Demat Account With
Upstox (FREE) – Click Here
Zerodha (Rs 300) – Click Here
SBI Card’s 10 financial highlights to look at before bidding for the IPO

Most analysts and market experts are positive on the forthcoming Rs 10,000 crore initial public offering of SBI Card, which is going to hit the market on March 2.
The company has set the price band for the share sale at Rs 750-755. Promoters SBINSE -1.90 % will offload 3.73 crore shares and Carlyle Group 9.32 shares. SBI Card’s market share in terms of the number of credit cards outstanding stands at 18 per cent. While these recommendations are good to refer to, investors should also do their own homework before investing in the public issue. Here are 10 key financial parameters of the company that may influence your investment decision.
Bottomline
Net profit of SBI Card for FY19 increased 43.52 per cent year-on-year to Rs 862.70 crore from Rs 601.10 crore reported for the year-ago period. The figure stood at Rs 372.80 crore in FY17.
Net interest income
This figure increased by nearly 25 per cent year-on-year to Rs 2,558.50 in FY19. NII stood at Rs 1,359.70 crore as of March 31, 2017.
Return on equity (RoE)
The company has been maintaining an RoE of over 25 per cent. This figure stood at 30 per cent in FY19, 32.40 per cent in FY18 and 28.60 per cent in FY17.
Return on assets (RoA)
The company reported a return on assets of 4.80 per cent in FY19 against 4.50 per cent in FY18. The figure stood at 4 per cent in FY17.
Total assets
Total assets of SBI Card stood at Rs 24,459.20 crore for the half-year ended September 2019 against Rs 20,239.60 crore as of March 31, 2018. The figure stood at Rs 15,686 crore and Rs 10,765 crore for the year ended March 31, 2018 and 2017, respectively.
Net worth
Net worth of the company jumped 147 per cent to Rs 3,581.70 crore in FY19 over Rs 1,448.80 crore in FY17.
Non-performing assets
Percentage of gross non-performing assets (NPA) of SBI Card stood at 2.30 per cent as of September 30. The figure stood at 2.40 per cent and 2.80 per cent in FY19 and FY18, respectively.
Earnings per share (EPS)
The figure jumped to Rs 16.40 during the first half of FY20 against Rs 10.60 in FY19 and Rs 7.70 in FY18.
Impairment losses and bad debts
The figure stood at Rs 1,102.10 crore as of September 30 against Rs 1,147.70 crore as of March 31, 2019. Impairment losses and bad debt stood at Rs 800.10 crore and Rs 532 crore in FY18 and FY17, respectively.
Operating profit (pre-provision)
Pre-provision operating profit of SBI Card increased 9.74 per cent to Rs 2,720.70 crore for the nine-month ended December 2019. The figure stood at Rs 2,479.30 crore and Rs 1,719.40 crore in FY19 and FY18, respectively.
15 Financial Ratios Every Investor Should Use

Financial ratios can help to make sense of the overwhelming amount of information that can be found in a company’s financial statements.
Knowing how to pick out small bits of important information, combine them with other small bits of information and interpret the resulting number is more of an art than a science. But it’s undoubtedly one of the most important arts that an investor should practice. To start your journey into ratio analysis, you’ll need a company’s consolidated financial statements, found in a company’s 10-K and available for free on the Moneycontrol and screener.in website. The three most important financial statements are the income statement, balance sheet and cash flow statement. Track these down before proceeding further.
While there are quite a few financial ratios, investors use a handful of them over and over again. These 15 ratios are indispensable tools that should be a part of every investor’s research process.
___________________________________________________________
Price Ratios
Price ratios are used to get an idea of whether a stock’s price is reasonable or not. They are easy to use and generally pretty intuitive, but do not forget this major caveat: Price ratios are “relative” metrics, meaning they are useful only when comparing one company’s ratio to another company’s ratio, a company’s ratio to itself over time, or a company’s ratio to a benchmark.
1) Price-to-Earnings Ratio (P/E)
What you need: Income Statement, Most Recent Stock Price
The formula: P/E Ratio = Price per Share / Earnings Per Share
What it means: Think of the price-to-earnings ratio as the price you’ll pay for ₹1 of earnings. A very, very general rule of thumb is that shares trading at a “low” P/E are a value, though the definition of “low” varies from industry to industry.
2) PEG Ratio
What you need: Income Statement, Most Recent Stock Price
The formula: PEG Ratio = (P/E Ratio) / Projected Annual Growth in Earnings per Share
What it means: The PEG ratio uses the basic format of the P/E ratio for a numerator and then divides by the potential growth for EPS, which you’ll have to estimate. The two ratios may seem to be very similar but the PEG ratio is able to take into account future earnings growth. A very general rule of thumb is that any PEG ratio below 1.0 is considered to be a good value.
3) Price-to-Sales Ratio
What you need: Income Statement, Most Recent Stock Price
The formula: Price-to-Sales Ratio = Price per Share / Annual Sales Per Share
What it means: Much like P/E or P/B, think of P/S as the price you’ll pay for ₹ 1 of sales. If you are comparing two different firms and you see that one firm’s P/S ratio is 2x and the other is 4x, it makes sense to figure out why investors are willing to pay more for the company with a P/S of 4x. The P/S ratio is a great tool because sales figures are considered to be relatively reliable while other income statement items, like earnings, can be easily manipulated by using different accounting rules.
4) Price-to-Book Ratio (P/B)
What you need: Balance Sheet, Most Recent Stock Price
The formula: P/B Ratio = Price per Share / Book Value per Share
What it means: Book value (BV) is already listed on the balance sheet, it’s just under a different name: shareholder equity. Equity is the portion of the company that owners (i.e. shareholders) own free and clear. Dividing book value by the number of shares outstanding gives you book value per share.
Like P/E, the P/B ratio is essentially the number of dollars you’ll have to pay for ₹ 1 of equity. And like P/E, there are different criteria for what makes a P/B ratio “high” or “low.”
5) Dividend Yield
What you need: Income Statement, Most Recent Stock Price
The formula: Dividend Yield = Dividend per Share / Price per Share
What it means: Dividends are the main way companies return money to their shareholders. If a firm pays a dividend, it will be listed on the balance sheet, right above the bottom line. Dividend yield is used to compare different dividend-paying stocks. Some people prefer to invest in companies with a steady dividend, even if the dividend yield is low, while others prefer to invest in stocks with a high dividend yield.
6) Dividend Payout Ratio
What you need: Income Statement
The formula: Dividend Payout Ratio = Dividend / Net Income
What it means: The percentage of profits distributed as a dividend is called the dividend payout ratio. Some companies maintain a steady payout ratio, while other try to maintain a steady number of dollars paid out each year (which means the payout ratio will fluctuate). Each company sets its own dividend policy according to what it thinks is in the best interest of its shareholders. Income investors should keep an especially close eye on changes in dividend policy.
___________________________________________________________
Profitability Ratios
Profitability ratios tell you how good a company is at converting business operations into profits. Profit is a key driver of stock price, and it is undoubtedly one of the most closely followed metrics in business, finance and investing.
7) Return on Assets (ROA)
What you need: Income Statement, Balance Sheet
The formula: Return on Assets = Net Income / Average Total Assets
What it means: A company buys assets (factories, equipment, etc.) in order to conduct its business. ROA tells you how good the company is at using its assets to make money. For example, if Company A reported ₹10,000 of net income and owns ₹ 100,000 in assets, its ROA is 10%. For ever ₹ 1 of assets it owns, it can generate ₹ 0.10 in profits each year. With ROA, higher is better.
8) Return on Equity (ROE)
What you need: Income Statement, Balance Sheet
The formula: Return on Equity = Net Income / Average Stockholder Equity
What it means: Equity is another word for ownership. ROE tells you how good a company is at rewarding its shareholders for their investment. For example, if Company B reported ₹ 10,000 of net income and its shareholders have ₹ 200,000 in equity, its ROE is 5%. For every ₹ 1 of equity shareholders own, the company generates ₹ 0.05 in profits each year. As with ROA, higher is better.
9) Profit Margin
What you need: Income Statement
The formula: Profit Margin = Net Income / Sales
What it means: Profit margin calculates how much of a company’s total sales flow through to the bottom line. As you can probably tell, higher profits are better for shareholders, as is a high (and/or increasing) profit margin.
____________________________________________________________
Liquidity Ratios
Liquidity ratios indicate how capable a business is of meeting its short-term obligations. Liquidity is important to a company because when times are tough, a company without enough liquidity to pay its short-term debts could be forced to make unfavourable decisions in order to raise money (sell assets at a low price, borrow at high-interest rates, sell part of the company to a vulture investor, etc.).
10) Current Ratio
What you need: Balance Sheet
The formula: Current Ratio = Current Assets / Current Liabilities
What it means: The current ratio measures a company’s ability to pay its short-term liabilities with its short-term assets. If the ratio is over 1.0, the firm has more short-term assets than short-term debts. But if the current ratio is less than 1.0, the opposite is true and the company could be vulnerable to unexpected bumps in the economy or business climate.
11) Quick Ratio
What you need: Balance Sheet
The formula: Quick Ratio = (Current Assets – Inventory) / Current Liabilities
What it means: The quick ratio (also known as the acid-test ratio) is similar to the quick ratio in that it’s a measure of how well a company can meet its short-term financial liabilities. However, it takes the concept one step further. The quick ratio backs out inventory because it assumes that selling inventory would take several weeks or months. The quick ratio only takes into account those assets that could be used to pay short-term debts today.
__________________________________________________________
Debt RatiosThese ratios concentrate on the long-term health of a business, particularly the effect of the capital and finance structure on the business:
12) Debt to Equity Ratio What you need: Balance Sheet The formula: Debt-to-Equity Ratio = Total Liabilities / Total Shareholder Equity
What it means: Total liabilities and total shareholder equity are both found on the balance sheet. The debt-to-equity ratio measures the relationship between the amount of capital that has been borrowed (i.e. debt) and the amount of capital contributed by shareholders (i.e. equity). Generally speaking, as a firm’s debt-to-equity ratio increases, it becomes riskier because if it becomes unable to meet its debt obligations, it will be forced into bankruptcy.
13) Interest Coverage Ratio
What you need: Income Statement
The formula: Interest Coverage Ratio = EBIT / Interest Expense
What it means: Both EBIT (aka, operating income) and interest expense are found on the income statement. The interest coverage ratio, also known as times interest earned (TIE), is a measure of how well a company can meet its interest payment obligations. If a company can’t make enough to make interest payments, it will be forced into bankruptcy. Anything lower than 1.0 is usually a sign of trouble.
.jpg)
Efficiency Ratios These ratios give investors insight into how efficiently a business is employing resources invested in fixed assets and working capital. It’s can also be a reflection of how effective a company’s management is.
14) Asset Turnover Ratio
What you need: Income Statement, Balance Sheet The formula: Asset Turnover Ratio = Sales / Average Total Assets
What it means: Like return on assets (ROA), the asset turnover ratio tells you how good the company is at using its assets to make products to sell. For example, if Company A reported ₹ 100,000 of sales and owns ₹ 50,000 in assets, its asset turnover ratio is 2x. For ever ₹ 1 of assets it owns, it can generate ₹ 2 in sales each year.
15) Inventory Turnover Ratio What you need: Income Statement, Balance Sheet
The formula: Inventory Turnover Ratio = Costs of Goods Sold / Average Inventory
What it means: If the company you’re analyzing holds has inventory, you want that company to be selling it as fast as possible, not stockpiling it. The inventory turnover ratio measures this efficiency in cycling inventory. By dividing costs of goods sold (COGS) by the average amount of inventory the company held during the period, you can discern how fast the company has to replenish its shelves. Generally, a high inventory turnover ratio indicates that the firm is selling inventory (thereby having to spend money to make new inventory) relatively quickly.
How are the Mutual Funds Taxed? Everything you should know

The portfolio of a mutual fund scheme generates returns from the appreciation in the value of the securities held and the income received on these securities, such as interest and dividend. These returns belong to the investor and reflect in the appreciation in the NAV of the scheme. The returns are received or realized by the investors either in the form of dividends paid by the mutual fund to the investors or as capital gains when the units are redeemed by the investor. These returns are taxable in the hands of the investor when they are received depending upon the nature of the investment, the period of holding the investment and the type of investor. Mutual fund schemes are considered equity-oriented schemes if not less than 65% of the net assets are invested in equity and equity-linked instruments.
Tax on Capital Gains – Capital gains tax applies to the gains realized on redemption or sale of units. The rate of tax depends on the nature of capital gains: short-term or long-term. The holding period of the investment before redemption in order to categorize the gains as short or long term capital gains depends upon the type of fund. In case of equity-oriented funds, if the units were held for not more than 12 months before they were redeemed or sold, the gains are considered short-term-term capital gains (STCG), else it is long-term capital gains (LTCG). For non-equity oriented schemes, the gains are categorized as short-term capital gains if the units were held for not more than 36 months before redemption. Else it is long-term capital gains. The tax on capital gains is as follows:
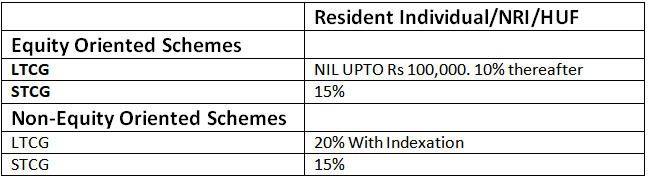
Indexation is the process of calculating long-term capital gains for tax purposes after adjusting the purchase price for inflation. The adjustment is done using the cost of inflation index issued by the Central Board for Direct taxes for each financial year. Indexation ensures that the increase in the value of the investment that can be attributed to inflation is not taxed, and only the real return is taxed.
NRI investors in mutual funds alone have tax deducted at source at the rate of 15% for STCG in equity-oriented funds and at the rate of 30% and 20% for STCG and LTCG from nonequity-oriented funds. Surcharge and education cess will be added to these rates as applicable.
Investors can set-off a capital loss incurred on the sale or redemption of their investments against taxable gains made on other investments. This will reduce the tax that has to be paid. This is called set-off and if a capital loss cannot be set-off against a capital gain of that particular year, it can be carried forward for the next eight years. The applicable rules are:
Short-term capital loss can be set-off against long-term and short-term capital gains.
Loss arising from a long-term capital asset can be set off only against long-term capital gains.
Short-term or long-term capital loss can be set off only against income under the head capital gains and not any other source of income.
A loss under any other head of income can be set off against short or long term capital gain.
Important Things to Consider Before Buying a Term Insurance Policy

TERM INSURANCE is a pure risk cover product. It pays a benefit only if the policyholder dies during the period for which one is insured. Term Life Insurance provides for life insurance coverage for a specified term of years for a specified premium. The premium buys protection in the event of death and nothing else. Term Insurance premiums are typically low because it only covers the risk of death and there is no investment component in it. The policy does not accumulate cash value, It offers the cheapest form of life insurance. The premium can remain the same or increase. A policyholder insures his life for a specified term. If he dies before that specified term is over, his estate or named beneficiaries receive a payout. If he survives the term. there is no maturity benefit.
The Three Key factors to be considered in term insurance are:
1) SUM INSURED (Protection or Death Benefit)
2) PREMIUM TO BE PAID (Cost of the Insured)
3) LENGTH OF COVERAGE (term)
- TENURE OF TERM INSURANCE
Till what age should you buy a Term Plan? Should a 25 Year Old Buy a Term Plan Up to 80 Years?
The answer is NO! you should not buy term insurance for the longest term possible. You only need term insurance up to the age of your retirement because not many of the family members are going to be dependent upon you after your retirement. It makes sense for you to buy a big cover when you are young because of more financial responsibilities. But as our age grows, our assets also grow and we reach towards retirement we no longer remain the provider for the family. - UNDERSTAND YOUR NEED FOR RIDERS
Most Common Riders which are offered with Term Insurance are
Accidental Death Rider
Permanent & Partial Disability
Critical Illness
Waiver of Premium
Income Benefit Rider
Riders are a great addon to your term insurance but don’t get overexcited by them. Understand your need for them and add only if you require them. If you are frequently engaged in travelling you have more risk of dying in an accident so in such case you should add an Accidental Death Rider. - AVOID BUYING RETURN OF PREMIUM POLICIES
Term Insurances are available in different options. Regular term insurance pays the sum assured in the event of death. Many Term Insurance policies are offered which returns you the premiums paid by you through the years at the end of the tenure of the policy.
This feature does comes at an added cost to the policy buyer. Such an added cost is what compensates the insurer for the repayment of the premium. Even though you get the premiums back, you do not get any returns on your money and since these plans are expensive, you have less left for investment purposes. - AVOID BUYING SMALL INSURANCE COVERS
India is one of the least insured, and the average sum insured only range between 1-1.5 lakhs. This is mostly because most of the people do not have term insurance. Nowadays most preferred sum insured is 80 Lakhs to 1 Cr . Is it Enough? NO! The tenure of term insurance can be up to over 40-50 years. It might not be enough for your family 25 years in the future because of the increasing cost of living.
So, How do we calculate the amount of life insurance cover required?
ADD – All Your Liabilities
ADD – 3000 x Your Monthly Expenses
ADD – Any amount which can help your family reach your other financial goals
Most Popular
General Insurance Market Share in India
for FY24 till October 2023 based on gross premium underwritten

Tata Technologies IPO: Key Details, Live Subscription, Financials, Strategy, Industry Growth, Strengths, Risks, and...
Live Subscription
About the CompanyTata Technologies Limited, established in 1994 and headquartered in Pune, India, is a key player in IT consultancy and engineering design...

What is Social Stock Exchange?
Introduction to Social Stock Exchange
A social stock exchange (SSE) is a platform or marketplace where socially and environmentally conscious organizations and impact-driven investors can...

What is Corporate Governance and why it is so important?
Introduction to Corporate Governance
Corporate Governance refers to the set of processes, principles, and values governing how a company is managed and controlled. It is...

Elon Musk’s Plan to Monetize Twitter
Twitter, the widely used microblogging platform, has faced difficulties in generating profits in recent years. In a bold move, Elon Musk acquired Twitter for...