| Bank | 2021-22 | 2020-21 | YoY Change |
| State Bank of India | 19,666 | 34,402 | -42.8% |
| Union Bank of India (UBI) | 19,484 | 16,983 | 14.7% |
| Punjab National Bank (PNB) | 18,312 | 15,877 | 15.3% |
| Bank of Baroda (BoB) | 17,967 | 14,782 | 21.5% |
| Bank of India | 10,443 | 8,815 | 18.5% |
| ICICI Bank Limited | 10,148 | 9,507 | 6.7% |
| HDFC Bank Limited | 9,405 | 9,289 | 1.2% |
| Axis Bank Limited | 9,126 | 12,018 | -24.1% |
| Indian Bank | 8,347 | 8,371 | -0.3% |
| Canara Bank | 8,210 | 7,642 | 7.4% |
| IndusInd Bank Limited | 4,385 | 4,055 | 8.1% |
| IDFC First Bank Limited | 4,202 | 1,433 | 193.2% |
| UCO Bank | 3,851 | 9,410 | -59.1% |
| Indian Overseas Bank | 3,769 | 4,618 | -18.4% |
| Bandhan Bank Limited | 3,247 | 2,038 | 59.3% |
| Bank of Maharashtra | 3,118 | 4,931 | -36.8% |
| IDBI Bank Limited | 2,889 | 8,392 | -65.6% |
| RBL Bank Limited | 2,294 | 1,675 | 37.0% |
| Standard Chartered Bank | 1,325 | 1,697 | -21.9% |
| Central Bank of India | 1,236 | 5,992 | -79.4% |
| Kotak Mahindra Bank Limited | 1,230 | 628 | 95.9% |
| Punjab and Sind Bank | 1,134 | 71 | 1497.2% |
| Yes Bank Limited | 971 | 12,240 | -92.1% |
| Federal Bank Limited | 929 | 398 | 133.4% |
| Karur Vysya Bank Limited | 879 | 619 | 42.0% |
| Ujjivan Small Finance Bank Limited | 789 | 74 | 966.2% |
| Jammu and Kashmir Bank Limited | 758 | 1,185 | -36.0% |
| South Indian Bank Limited | 700 | 1,135 | -38.3% |
| City Union Bank Limited | 629 | 412 | 52.7% |
| Jana Small Finance Bank Limited | 585 | 233 | 151.1% |
| Karnataka Bank Limited | 585 | 1,060 | -44.8% |
| Citibank N.A. | 576 | 370 | 55.7% |
| DBS Bank India Limited (DBIL) | 438 | 139 | 215.1% |
| Fincare Small Finance Bank Limited | 370 | 28 | 1221.4% |
| Equitas Small Finance Bank Limited | 360 | 245 | 46.9% |
| Tamilnad Mercantile Bank Limited | 321 | 393 | -18.3% |
| Corporation Limited | 234 | 185 | 26.5% |
| Suryoday Small Finance Bank Limited | 231 | 97 | 138.1% |
| Utkarsh Small Finance Bank Limited | 219 | 35 | 525.7% |
| American Express Banking | 215 | 127 | 69.3% |
| Deutsche Bank AG | 213 | 485 | -56.1% |
| AU Small Finance Bank Limited | 188 | 115 | 63.5% |
| Cooperatieve Rabobank U.A. | 175 | 0 | NA |
| Barclays Bank PLC | 163 | 73 | 123.3% |
| Nainital Bank Limited | 119 | 1 | 11800.0% |
| CSB Bank Limited | 110 | 138 | -20.3% |
| DCB Bank Limited | 88 | 126 | -30.2% |
| The Dhanalakshmi Bank Limited | 83 | 14 | 492.9% |
Amounts written off by Banks as NPAs in FY22 and FY21

Smallcase Vs Mutual Funds, What’s Better?
Mutual Funds are pooled assets that are managed by experienced professionals hired by the AMCs whereas anyone who is registered with SEBI as an Investment Advisor or Research Analyst can create a Smallcase to which an investor can subscribe.
We have divided the comparison into Costs, Taxation, Returns, Portfolio, Transparency, Risk & Suitability.
Costs
Smallcases come with free & paid options,
Free Smallcases consist of simpler portfolios which include ETFs, thematic, and sectoral portfolios. The “FREE” Smallcases are just there to help you understand how the “product” works. Most “Free” Smallcases other than which include ETFs, are not suitable for an average investor due to high concentration on individual sectors, where even if you choose multiple sectoral Smallcases, in that case, you would just be owning too many stocks, making matters only worse.
Paid Smallcases subscription costs vary. These have a higher frequency of rebalancing & active management to achieve better results. Only subscribe to a smallcase if the percentage-wise costs come out to be lower than 2% which can be calculated as % of fees divided by the Amount to be invested
For eg, if you are looking to invest 2 Lakh Rupees in a Smallcase & the Smallcase itself costs ₹15,000 a year, it would translate into 7.5% per annum, if you are paying 7.5% p.a you would need your smallcase to give at least 7.5% return in a year just to breakeven so, It’s advisable to pay not more than 2% in fees.
Mutual Funds have fees also known as the Expense Ratio which varies from 0.10% to 2% p.a of investment value and an Exit Load of 1% which is applicable only if you exit before a year.
Taxation
Both (Equity MFs & Smallcases) come under Capital Gains, But it works differently in both cases. There are two types of Capital Gains Tax;
Short-Term Capital Gains: When you exit your investments within a year, the profit realised on that investment is taxed at 15% FLAT.
Long-Term Capital Gains: When you exit your investments after a year, the profit realised on that investment is tax-free to an extent of ₹1 Lakh, profit above 1 Lakh is taxed at 10% FLAT.
The Twist: When you reshuffle your Smallcase portfolio and you realise any profit on investments you sell become taxable at a rate of 15% if the investment was held for less than a year. On the other hand in the case of Mutual Funds, when the fund manager reshuffles the portfolio of the scheme the taxability doesn’t arise. The taxability only arises when an investor exits from the scheme itself.
This is a huge disadvantage of Smallcase, the post-tax returns of a Smallcase could be a lot lower than what is presented on the website.
Returns
Smallcases do have a higher chance of outperforming the market & Mutual Funds due to less number of stocks in a Smallcase, most adopting a concentrated portfolio approach by owning not more than 20 stocks in a Smallcase. The CAGR you see on Smallcase doesn’t necessarily translate to real returns (post-tax & charges) because there’s a possibility that the CAGRs mentioned may have been achieved by frequent reshuffling of stocks. More transactions translate into more charges, which may damage your post-expense returns in a big way.
Mutual Funds, on the other hand, are expected to give close to market returns i.e the Index. The past returns mentioned on websites are post-expense past performance.
Risk
Smallcase: Concentrated & Momentum approach followed by most smallcases while may translate into lucrative returns in a bull market, It may backfire when the market cycle reverts. Having said that an Investment Advisor can choose to go in cash for a large part of the portfolio or shift to safer bets. Risk in Smallcases depends a lot on the competency, knowledge & experience of the Advisor.
Mutual Funds: An average mutual fund portfolio consists of 35 to 60 stocks & follows a diversified approach. A mutual fund’s risk is equivalent to that of an Index. Cash holding in a mutual fund scheme doesn’t exceed 10% limiting the ability of a Mutual Fund manager to minimise market risk.
Transparency
Smallcase: Changes made in a Smallcase are made known to you in no time, your smallcase portfolio holdings show up in your Demat account just like other stocks that you have invested in, and the purchase price of a stock is also known to you. The performance of the Smallcase can be tracked in real-time. But there is a problem, you will only know the securities or sector allocation in a smallcase after you subscribe to it.
Mutual Funds: A portfolio of schemes is released by the AMC every month, which includes all the detail about the portfolio & securities held by the scheme, except the average cost. NAV & day’s performance is updated once a day by the AMCs.
Suitability:
- If you have a small amount to invest, you are better off investing in a Free Smallcase with ETFs or in Mutual Funds.
- Someone looking to chase momentum for higher returns also bearing in mind the relatively higher risk involved can choose Smallcase.
- Choosing a Premium Smallcase is not easy, and even more difficult to analyse than a mutual fund, why? A portfolio of a smallcase is not known to you before you subscribe to it. The only benchmark you have to judge a scheme is by historical performance which ignores the costs & capital gains tax due to reshuffling. When purchasing a Smallcase you better be knowing who is the manager of the Smallcase & be confident in his or her abilities to manage a portfolio.
Bikaji Foods IPO Details, Schedule, Allotment Link, Financials, Latest GMP

About Company
The company is engaged in selling Indian snacks and sweets which include six principal categories; bhujia, namkeen, packaged sweets, papad, western snacks as well as other snacks that primarily includes gift packs (assortment), frozen food and cookies.
As of September 30, 2021, Bikaji Foods has operations across 22 states and three union territories in India. And also exports its products to 35 countries internationally including countries in North America, Europe, the Middle East, Africa, and the Asia Pacific representing 4.60% of the company’s sales of food products in the six months ending September 30, 2021.
IPO Details
| IPO Date | Nov 3, 2022 to Nov 7, 2022 |
| Listing Date | 16 November 2022 |
| Price Band | ₹285 to ₹300 per share |
| Lot Size | 50 Shares |
| Issue Size | ₹881.22 Cr (Only Offer for Sale) |
| Minimum Application | ₹15,000 |
| GMP (Last Updated 2 Nov) | ₹73 per share |
| QIB Quota | 50% of the Issue Size |
| NII Quota | 15% of the Issue Size |
| Retail Quota | 35% of the Issue Size |
Schedule
| Issue Period | 3rd November to 7th November 2022 |
| Finalization of Allotment | 11th November 2022 |
| Initiation of Refunds | 14th November 2022 |
| Credit of Shares | 15th November 2022 |
| Date of Listing | 16th November 2022 |
| Mandate end date | 22nd November 2022 |
| Anchor Investors Lock-In End Date | 7th December 2022 |

Objects of the Issue
The selling shareholders are entitled to the entire proceeds of the Offer after deducting the Offer expenses, and relevant taxes/ The company will not receive any proceeds from the IPO.
Financial Highlights
| Particulars | FY20 | FY21 | FY22 |
| Revenue from Operations (₹ Crores) | 1,074.55 | 1,310.75 | 1610.96 |
| EBITDA (₹ Crores) | 94.6 | 144.77 | 139.54 |
| EBITDA Margin (%) | 8.80% | 11.04% | 8.66% |
| Net Profit (₹ Crores) | 56.37 | 90.34 | 76.03 |
| RONW (%) | 10.65% | 14.93% | 9.51% |
| ROCE (%) | 12.79% | 20.88% | 13.89% |
Strengths
- Well-established brand: The company sells all products under a well-established Bikajo brand with a focus on a diverse range of quality products, authentic ethnic Indian taste, and effective pricing strategies covering all key price points. These qualities have helped them develop strong brand recognition and consumer loyalty.
- Extensive distribution network: The company has developed a large pan-India distribution network. They had six depots, 38 super stockists, 416 direct and 1,956 indirect distributors that work with super stockists, located across 23 states and four union territories in India ( June 2022).
Risks
- Dependency on a single segment: The financial performance of the company is dependent on its bhujia products. On average, the segment contributes around 35% of the company’s total sales. If they are unable to evolve consumer tastes, preferences, and demand for particular products, the financials will be impacted.
- Investments in unsecured debt instruments: The Company has made investments in unsecured debt instruments of Hanuman Agrofood in the form of compulsorily convertible debentures amounting to Rs 106.23 crore, and optionally convertible debentures of Dadiji Snacks Private Limited amounting to Rs 11.5 crore.
Pay 6.4% less on your Insurance, Utility Bill Payments using SBI Cashback Card and Yono GYFTR

Bill Payments and Insurance generally account for most of one’s personal expenses, There is a way you can save at least 6.4% on these expenses. The process is pretty simple and all you need is the newly launched SBI Cashback Card, the card offers 5% cashback (up to ₹10,000 p.m) on all online transactions except Insurance, Utility Bill Payments. Don’t get discouraged we have found our way around it. Follow the steps down below,
1. Visit the Yono GYFTR: Yono GYFTR is a gift card marketplace for SBI Card holders (Debit & Credit).

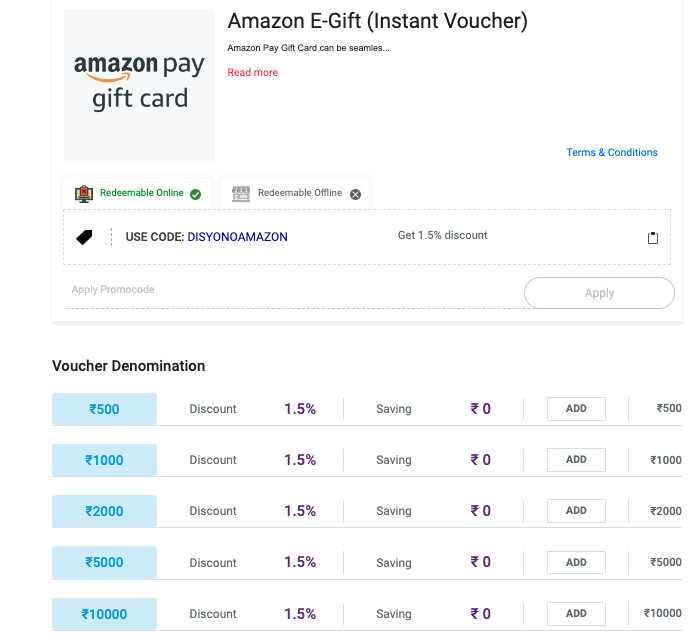
2. Buy the Amazon Gift Voucher: Amazon Gift Vouchers are available in the denominations of ₹500, ₹1,000, ₹2,000, ₹5,000 & ₹10,000.
apply the “DISYONOAMAZON” code to get 1.5% off on the purchase.
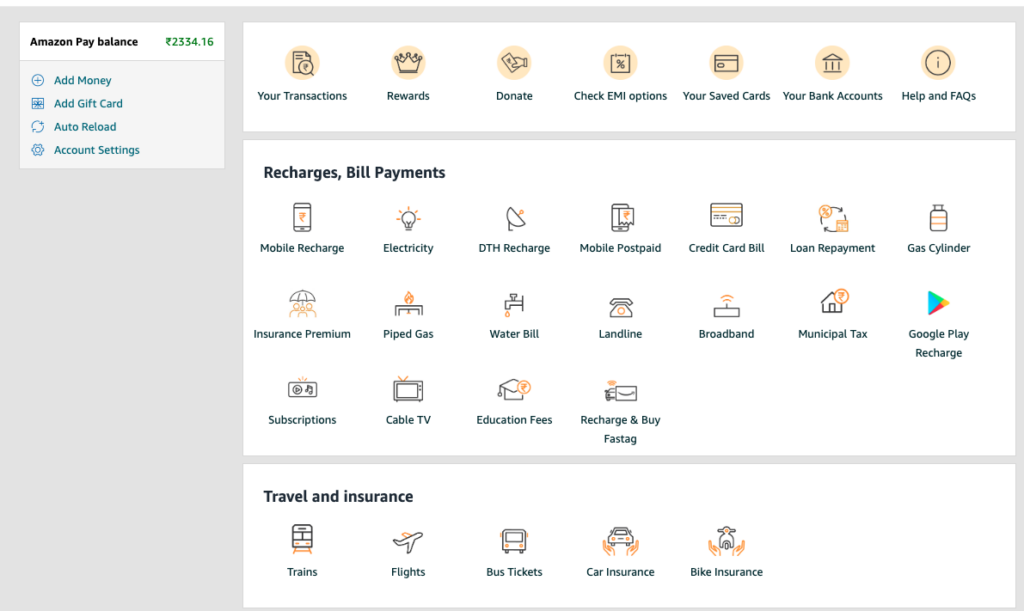
3. Redeem the Voucher in Amazon Pay: Use the redeemed gift card balance to make payments for Insurance, Electricity, Landline, Gas, Recharge, Phone Bills etc.
Let’s say you buy a ₹10,000 Voucher from the GYFTR portal, your total value back will work around at ₹642 or 6.42% (₹150 GYFTR discount & ₹492.5 Cashback on SBI Cashback Card)
Bonus: You can even use your Amazon Pay Balance to purchase an HPCL Gift Card of ₹5,000 which can be redeemed at HPCL outlets for payment for Petrol, Diesel. There is a delivery charge of ₹100, but even after accounting for that, you will still be saving 5.42%.
Not Holding the SBI Cashback Card? Apply using our referral link
Fusion Microfinance, IPO Details, Schedule, Allotment Link, Financials, Latest GMP
About Company
Fusion Micro Finance, located in New Delhi and established in 2010, is a micro-lending company that provides funding to women in rural and semi-urban regions so they may take advantage of more options for employment. Fusion offers loans up to Rs. 50,000 and employs a joint liability group concept created by the Grameen Bank of Bangladesh.
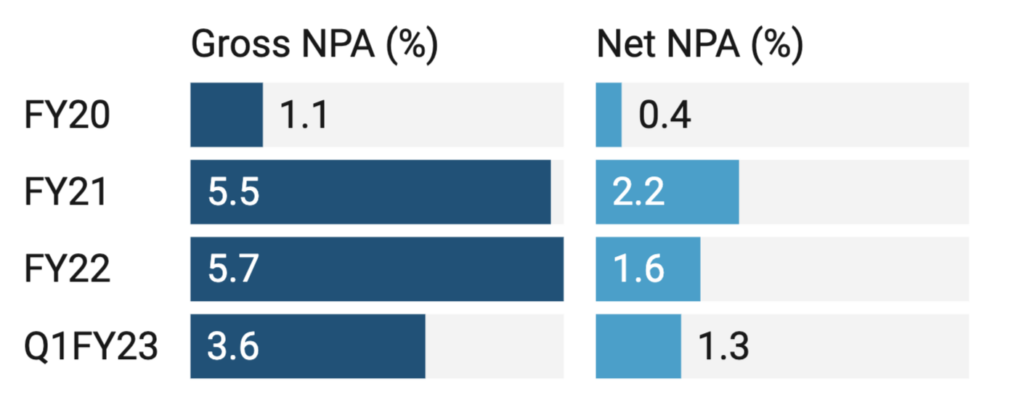
As of June 30, 2022, and March 31, 2022, 2021 and 2020, total AUM stood at ₹7,389.0 Cr, ₹6,785.9 Cr, ₹4,637.8 Cr and ₹3,606.5 Cr respectively. As of June 30, 2022, the share of AUM from customers in rural areas represented 91.3% of the total AUM. FMFL’s focus customer segment is women in rural areas with an annual household income of up to ₹300,000. Their business runs on a joint liability group lending model wherein a small number of women form a group (typically comprising five to seven members) and guarantee one another’s loans. As of June 30, 2022, and March 31, 2022, 2021 and 2020, gross NPA ratio was at 3.6%, 5.7%, 5.5% and 1.1%, respectively, and net NPA ratio was 1.3%, 1.6%, 2.2% and 0.4% respectively.
IPO Details
| IPO Date | Nov 2, 2022 to Nov 4, 2022 |
| Listing Date | 11 November 2022 |
| Price Band | ₹350 to ₹368 per share |
| Lot Size | 40 Shares |
| Issue Size | ₹1,104 Cr ( ₹600 Cr Fresh, 504 Cr Offer for Sale) |
| Minimum Application | ₹14,720 |
| GMP (Last Updated 31st Oct) | ₹33 per share |
| QIB Quota | 50% of the Issue Size |
| NII Quota | 15% of the Issue Size |
| Retail Quota | 35% of the Issue Size |
Schedule
| Issue Period | Nov 2, 2022 to Nov 4, 2022 |
| Finalization of Allotment | 10th November 2022 |
| Initiation of Refunds | 11th November 2022 |
| Credit of Shares | 14th November 2022 |
| Date of Listing | 15th November 2022 |
| Anchor Investors Lock-In End Date | 4th December 2022 |
Objects of the Issue
- Augment the capital base of the microfinance firm.
Financial Highlights
| Date | Q1 FY23 | FY22 | FY21 | FY20 |
| Revenue (₹ Crores) | 342.72 | 1151.26 | 855.81 | 720.26 |
| Net Profit (₹ Crores) | 75.1 | 21.75 | 43.94 | 69.61 |
| EPS (diluted) | 8.98 | 2.64 | 5.49 | 10.32 |
Asset Quality
Strengths
- Diversified and extensive pan-India presence: As of June 30, 2022, the company had 29 lakh active borrowers who were served by 966 branches and 9,262 employees across 377 districts in 19 states and UTs in India. No single state contributed to more than 20%of total AUM, and the proportion of AUM in the five largest states in terms of AUM concentration further decreased from 94.6% as of March 31, 2016, to 66.1% as of June 30, 2022
- Potent underwriting process, and risk management policies: As of Q1FY23, FY22, FY21 and FY20 gross NPA ratio was 3.6%, 5.7%, 5.5% and 1.1%, respectively, and net NPA ratio was 1.3%, 1.6%, 2.2% and 0.3%, respectively. According to Crisil, the company had the sixth lowest gross NPA ratio among the top 10 NBFC-MFIs in India during FY22, and average asset quality of 2.4% between FY15 and FY22 was the lowest among all NBFCMFIs operating in North India.
Risks
- Higher NPAs: Even if credit monitoring and risk management policies and procedures are adequate and appropriately implemented, the company may not be able to anticipate future economic or financial developments or downturns, which could lead to an increase in NPAs. If NPAs increase or the credit quality of borrowers deteriorates, it could have an adverse effect on business, financial condition, results of operations and cash flows.
- Competition from other MFIs, banks, and financial institutions: The company faces the most significant organised competition from other MFIs, banks and state-sponsored social programs in India. Traditional commercial banks as well as regional and cooperative banks may continue to increase their participation in microfinance.
DCX Systems IPO Details, Schedule, Allotment Link, Financials, Valuation, Latest GMP
About the Company
Incorporated in 2011, DCX Systems Limited (DSL) is among the leading Indian players in the manufacture of electronic sub-systems and cable harnesses. The company operates through their manufacturing facility located at the Hi-Tech Defense and Aerospace Park SEZ in Bengaluru, Karnataka.
As of June 30, 2022, DCX Systems had 26 customers in Israel, the United States, Korea and India and its customers include domestic and international OEMs, private companies and public sector undertakings in India across different sectors, ranging from defence and aerospace to space ventures and railways.
IPO Details
| IPO Date | Oct 31, 2022 to Nov 2, 2022 |
| Listing Date | 11 November 2022 |
| Price Band | ₹197 to ₹207 per share |
| Lot Size | 72 Shares |
| Issue Size | ₹500 Cr (₹400 Cr Fresh, ₹100 Cr Offer for Sale) |
| Minimum Application | ₹14,904 |
| GMP (Last Updated 31 Oct) | ₹80 per share (38%) |
| QIB Quota | 75% of the Issue Size |
| NII Quota | 15% of the Issue Size |
| Retail Quota | 10% of the Issue Size |
Timetable
| Issue Period | 31st October to 2nd November 2022 |
| Finalization of Allotment | 7th November 2022 |
| Initiation of Refunds | 9th November 2022 |
| Credit of Shares | 10th November 2022 |
| Date of Listing | 11th November 2022 |
| Mandate end date | 17th November 2022 |
| Anchor Investors Lock-In End Date | 30th November 2022 |
Allotment Link
Objects of the Issue
The net proceeds from the IPO will be utilized for the below purposes:
- Repayment/ prepayment of certain borrowings availed of by the Company.
- Funding working capital requirements of the Company.
- Investment in a wholly owned Subsidiary, Raneal Advanced Systems Private Limited, to fund its capital expenditure expenses.
- General corporate purposes.

Financial Highlights
| Particulars | FY20 | FY21 | FY22 |
| Assets (₹ Crores) | 698.85 | 793.18 | 942.62 |
| Revenue (₹ Crores) | 449.3 | 641.2 | 1,102 |
| PAT (₹ Crores) | 9.7 | 29.6 | 65.61 |
| ROCE | 19.2 | 4.2 | 13.15 |
| ROE | 56.8 | 63.2 | 55.8 |
Valuation
At the higher end of the price band, DCX Systems IPO is reasonably priced at post-issue at 31 times FY22 earnings (consolidated). This is lower than peers Bharat Electronics (34 times), Data Patterns (61 times), Paras Defence (97 times), and Astra Microwave (97 times). Interestingly, DCX Systems has reported a better RoNW than these listed peers.
Growth Potential
- Strengthen system integration operations: The company intends to expand its existing cable and wire harness assembly operations to better serve the requirements of global customers.
- Focus on adjacent industry verticals: They intend to focus on the products identified in the Positive Indigenization List by the Ministry of Defence, (GoI), which they believe will provide opportunities to obtain transfer of technology.
- Cross-selling of products: They plan to increase cross-selling of products to increase customer base in various product verticals and expand into new or adjacent product verticals with existing customers. DCX will continue to leverage existing customer relationships to expand into new product categories.
- Penetrate into new geographies: They intend to identify opportunities in overseas jurisdictions and tie up with local partners to utilize existing product portfolios and further develop products suitable for meeting the respective country’s native requirements.
Risks
Heavy dependency on top three customers: DCX’s top three customers account for 96.83% of its revenue from operations in the three months ended June 30, 2022, respectively. The loss of one or more such customers or a reduction in their demand for DCX’s products will adversely affect its financials.
Order book may not translate to future income: The company has a strong order book of ₹2,563.63 Cr (as of June 30, 2022) but the order book may not necessarily translate into future income in its entirety. Some of the current orders received may be modified, cancelled, delayed, put on hold, or not fully paid, which could adversely affect the results of operations.
Top Private Banks Q2FY23 Earnings Comparison
| Particulars | ICICI Bank | HDFC Bank | Kotak Mahindra | Axis Bank |
|---|---|---|---|---|
| NII | ₹14,787 | ₹21,021 | ₹6,620 | ₹10,360 |
| NII Growth YoY | 26% | 18.9% | 24% | 31% |
| Net Profit | ₹7,558 | ₹10,606 | ₹3,608 | ₹5,330 |
| Profit Growth YoY | 37% | 20% | 21% | 70% |
| Advances Growth YoY | 24% | 23.4% | 25% | 18% |
| Net Interest Margin | 4.31% | 4.1% | 5.17% | 3.96% |
| Gross NPA | 3.19% | 1.23% | 2.08% | 2.50% |
| Net NPA | 0.61% | 0.33% | 0.55% | 0.51% |
| CAR | 18.27% | 18.0% | 22.6% | 17.72% |
| CASA | 45% | 45.4% | 56.2% | 46% |
4 ways to get the best out of your Systematic Investment Plan (SIP)

A systematic Investment Plan (SIP) is an investment route offered by Mutual Funds wherein one can invest a fixed amount in a Mutual Fund scheme at regular intervals– say once a month or once a quarter, instead of making a lump-sum investment.
SIP has been gaining popularity among Indian MF investors, as it helps in investing in a disciplined manner without worrying about market volatility and timing the market. SIP is easily the best way to enter the world of investments, here are some tips to get the best out of your SIP investments
1. Choose Direct Plans
Direct plans have lesser costs and give higher returns than regular plans. If the Total Expense Ratio (TER) of a regular plan is 0.75% more than that of the direct plan, then the direct plan will give a 1% higher CAGR return than the regular plan. Over a long investment horizon, if you compare the returns of mutual fund direct vs regular plans, the direct plans can add up to a substantial amount of difference in returns on your investment.
2. LTCG Tax Harvesting
Tax harvesting is utilising the tax-free window of Rs 1 lakh to reduce the overall LTCG tax. If you have invested and gained Rs 1 lakh, you can sell your investment, realise that gain, and invest it back without being liable to pay taxes. On the surface, LTCG tax harvesting savings could appear insignificant. However, when your portfolio expands and the period of wealth generation lengthens, these modest sums can easily add up to substantial sums.
3. Invest during drawdowns
Maintain a separate fund that is only used for stock market corrections. The stock market is subject to corrections; on average, the Nifty 50 has dropped more than 10% from its high each year at some point. By adding more to the mutual fund investments in response to corrections like these, you can improve your CAGR returns.
4. Choose Top-Up SIP
In a Top-up SIP, the investor increases his SIP amount every year, As an individual increases his income over time, it makes sense to increase investment contributions at the same rate. Top-up SIP helps in accumulating a higher amount of money, achieving your financial goals faster & keeping up with inflation.
Open Demat Account with India’s Number One Stock Broker; Zerodha
Mahurat Trading Day: Nifty 50 Performance History, Trading Hours & more

Diwali is the festival of lights and auspicious times. People buy gold, vehicles, and other such valuable items in the days of Diwali as it’s believed to bring prosperity (barkat) and happiness in their lives. While there are abundant ways of celebrating Diwali, Indian stock exchanges like NSE and BSE celebrate by conducting a special one-hour ‘Muhurat Trading Session’ that marks the beginning of the Hindu Calendar year.
Digging deep into the history of Muhurat Trading, traditionally, stockbrokers started their new year on Diwali. Hence, they would open new settlement accounts for their clients in this auspicious period – The Muhurat. With diverse cultures, the beliefs associated with Muhurat Trading also varied. Today, Muhurat Trading has become more of a symbolic gesture than a cultural one as Hindu investors perform Lakshmi Pujan and purchase shares of strong companies that guarantee good future returns.
Stock exchanges BSE and NSE will conduct the once-in-a-year Muhurat trading on 24th October 2022, Monday from 6.15 pm to 7.15 pm as the trading community welcomes Day 1 of the Hindu accounting calendar Samvat.
Nifty 50 Levels on Deepawali over the years
Nifty 50 performance on the Mahurat Trading Day